What Is Peak Hour Factor in Traffic Engineering? A Simple Guide to PHF Traffic Meaning
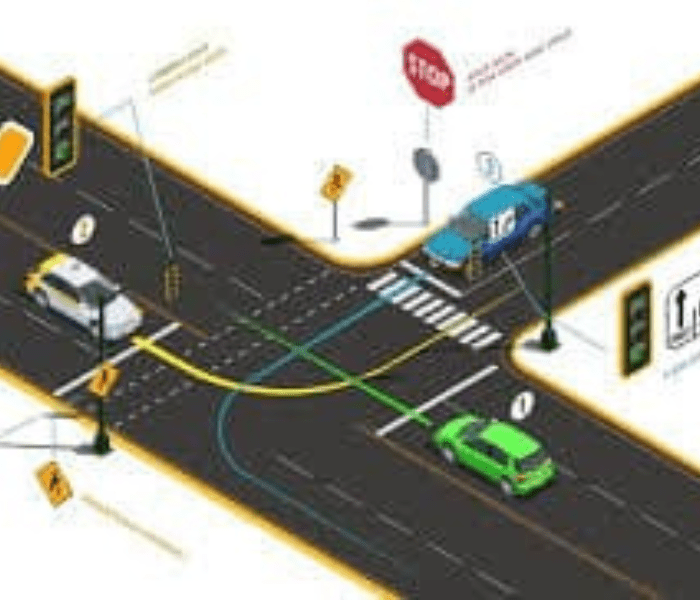
Traffic doesn’t move the same way all day. Some hours stay calm while others feel like a pressure cooker on wheels. That’s where the Peak Hour Factor becomes useful. It helps engineers study peak hour traffic and understand how vehicles arrive during the busiest time. Instead of trusting average numbers, they look deeper into traffic volume analysis and real traffic demand patterns.
This simple ratio shows whether vehicles move steadily or rush in sudden waves. When engineers track the vehicle flow rate during peak periods, they can design safer roads, smarter signals, and smoother travel experiences for everyday drivers.
Definition of Peak Hour Factor in Traffic Engineering
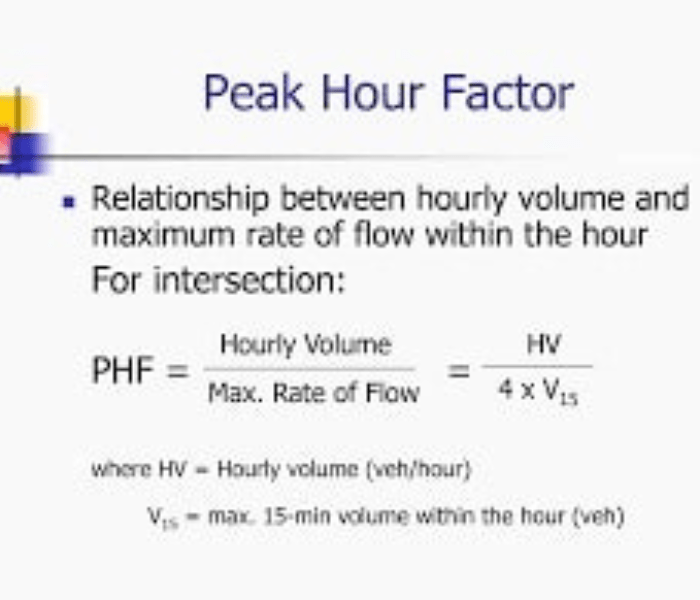
The Peak Hour Factor in Traffic Engineering describes how evenly vehicles move during the busiest hour. It compares the hourly traffic volume with the highest 15-minute traffic count inside that hour. This ratio shows whether traffic arrives steadily or in sudden bursts.

Traffic engineers use this ratio as a core transportation planning metric. It reveals vehicle movement patterns and highlights fluctuating traffic volumes. When the factor is high, roads experience consistent traffic flow. When it is low, engineers notice higher congestion risk during short intervals.
Purpose of Peak Hour Factor in Traffic Engineering
The main purpose of the Peak Hour Factor is to show how demand changes within a single hour. Average numbers often hide real problems. With PHF, traffic engineers can perform peak period analysis and predict pressure on roads more accurately.
This value supports traffic capacity analysis and guides road design decisions. It also helps with signal timing adjustments at busy intersections. When planners understand traffic demand patterns, they create safer transportation infrastructure and improve roadway efficiency across growing cities.
Typical PHF Values in Peak Hour Factor in Traffic Engineering
Typical values depend on road type and location. Urban highways often show higher values because of steady commuter flows. Rural roads may show lower values due to irregular travel times and seasonal demand.
Road Type Typical PHF Range Traffic Pattern
Urban Freeway 0.85–0.95 Steady commuter flow
Arterial Road 0.80–0.90 Moderate peaks
Rural Highway 0.75–0.90 Irregular demand
Signalized Intersection 0.80–0.95 Controlled flow
These ranges help engineers compare urban traffic patterns and study intersection performance. They also support road capacity planning and improve traffic congestion measurement during peak demand periods.
Example of Peak Hour Traffic Calculations
Imagine a road where the total hourly traffic volume is 1,200 vehicles. During the busiest quarter hour, 350 vehicles pass through. Engineers use this 15-minute traffic count to calculate the Peak Hour Factor.
PHF = 1,200 ÷ (4 × 350)
PHF = 1,200 ÷ 1,400
PHF = 0.86
This value shows steady movement with moderate peaks. It helps in vehicle flow rate studies and supports traffic study results used for capacity evaluation and traffic control methods.
Interpretation of PHF Values in Traffic Engineering
PHF values reveal how traffic behaves. High values suggest smooth movement across the hour. Low values show sudden surges that can overwhelm roads.
PHF Value Meaning Condition
0.95–1.00 Very even flow Low congestion
0.85–0.94 Normal conditions Moderate peaks
0.75–0.84 Noticeable surge Possible delays
Below 0.75 Sharp peak High congestion
These ranges guide traffic management strategies. They help engineers predict peak demand conditions and protect road network performance from overload.
Importance in Road Design Using Peak Hour Factor
The Peak Hour Factor in Traffic Engineering plays a key role in design choices. Engineers use it to decide lane numbers, turning bays, and signal timing. It ensures roads handle the traffic peak period without sudden gridlock.
Ignoring PHF can lead to under-designed roads. This causes poor intersection traffic flow and weak efficient road networks. By studying roadway design factors, planners improve safety and reduce delays across urban transportation systems.
PHF in Traffic Studies and Data Collection
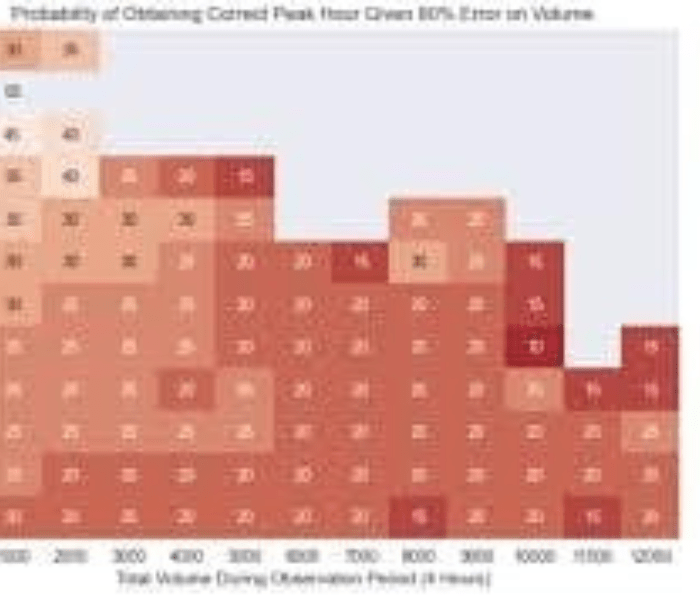
During traffic studies, engineers collect data through cameras, sensors, and manual counts. These traffic count methods capture real conditions and feed into traffic volume analysis. The goal is to understand how demand changes over short intervals.
Modern studies rely on real-time traffic data from smart traffic sensors. This information improves transportation planning and strengthens traffic control methods. It also supports long-term transportation infrastructure decisions.
Practical Applications of Peak Hour Factor in Traffic Engineering
PHF appears in many real projects. It helps design highways, shopping center access roads, and school zones. Engineers use it to manage peak hour traffic and reduce delays during busy periods.
For example, a stadium exit often creates a sharp surge. A low PHF warns engineers about this risk. They then adjust signals and lanes. These changes improve traffic congestion measurement and protect roadway efficiency across busy corridors.
Key Takeaways About Peak Hour Factor in Traffic Engineering
The Peak Hour Factor in Traffic Engineering shows how traffic behaves during the busiest hour. It compares total volume with the highest short-term surge. This simple ratio helps traffic engineers understand demand, reduce congestion risk, and build safer, more reliable roads.
Meta Description
Learn what Peak Hour Factor in traffic engineering means, how it’s calculated, and why it matters for road design and congestion control.
FAQs
What is the peak hour factor in traffic engineering?
It is a ratio that shows how evenly traffic is distributed during the busiest hour by comparing total hourly volume to the highest 15-minute flow.
What is peak hour of traffic?
Peak hour is the 60-minute period in a day when the highest number of vehicles use a road or intersection.
Why do engineers need to know the peak hour factor?
They use it to design roads, set signal timings, and prevent congestion during the busiest traffic periods.
How to use peak hour factor?
Engineers apply PHF in capacity analysis, signal design, and roadway planning to handle short-term traffic surges.
How is peak factor calculated?
It is calculated by dividing the total hourly traffic volume by four times the highest 15-minute volume.
What is TMS and SMS?
TMS stands for Traffic Management System, while SMS usually refers to Safety Management System or Short Message Service depending on context.
What is the peak factor?
Peak factor is a general term describing how demand increases during peak periods compared to average conditions.
What does peak hour mean?
Peak hour means the time of day when traffic demand reaches its highest level.
Peak hour Factor formula
PHF = Total hourly volume ÷ (4 × highest 15-minute volume).
What is peak hour factor in traffic engineering pdf?
It usually refers to downloadable study material or manuals explaining the PHF concept, formula, and examples.
What is peak hour factor in traffic engineering formula?
PHF = V ÷ (4 × V15), where V is hourly volume and V15 is the highest 15-minute volume.
What is peak hour factor in traffic engineering example?
If hourly traffic is 1,200 vehicles and the highest 15-minute count is 350, PHF = 1,200 ÷ 1,400 = 0.86.
What is peak hour factor in traffic engineering 2026?
The concept remains the same in 2026, used in modern traffic studies with smart sensors and real-time data.
Peak hour factor problems and solutions?
Problems involve calculating PHF from traffic counts, while solutions use the standard PHF formula.
What is peak hour factor in traffic engineering calculator?
It is an online or software tool that automatically computes PHF using hourly and 15-minute traffic data.
Peak hour factor water demand?
In water systems, peak factor shows the ratio between peak water demand and average demand during the highest usage period.