How to Read an Intersection Traffic Count Table: A Complete USA Guide for Beginners
Understanding How to Read an Intersection Traffic Count Table gives you real insight into how traffic actually moves through a junction. At first glance the numbers may look confusing. However once you understand the logic behind a turning movement count, the story becomes clear.
Each row reflects vehicle movements from a specific intersection approach, while totals reveal overall traffic volume patterns. Engineers use this information to evaluate roadway performance, adjust signals, and plan upgrades. When you learn to read these tables correctly, you stop seeing random numbers and start seeing traffic behavior in motion across real American roads.
What Is an Intersection Traffic Count Table?
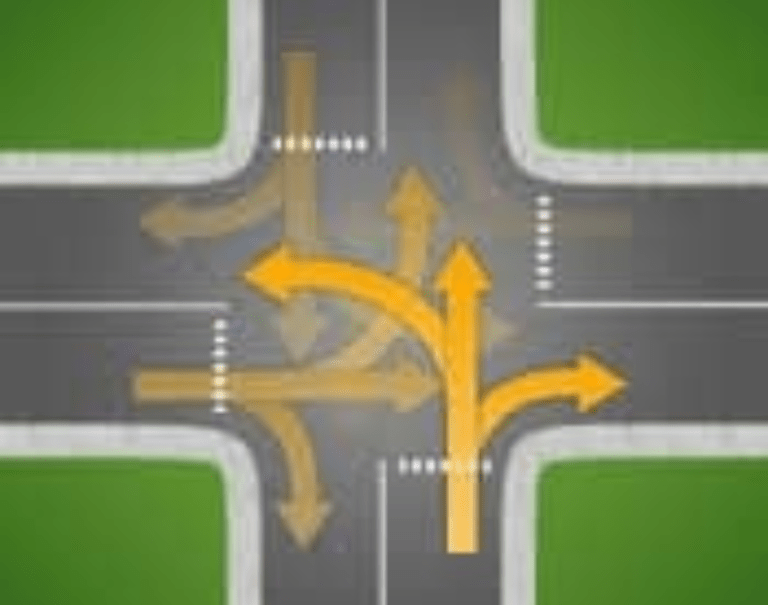
An intersection traffic count table shows how many cars pass through each intersection approach during a specific time. Engineers collect TMC data by counting vehicle movements such as left turn volume, through movement, and right turn volume. This is the foundation of understanding traffic count tables and mastering how to read traffic volume tables.
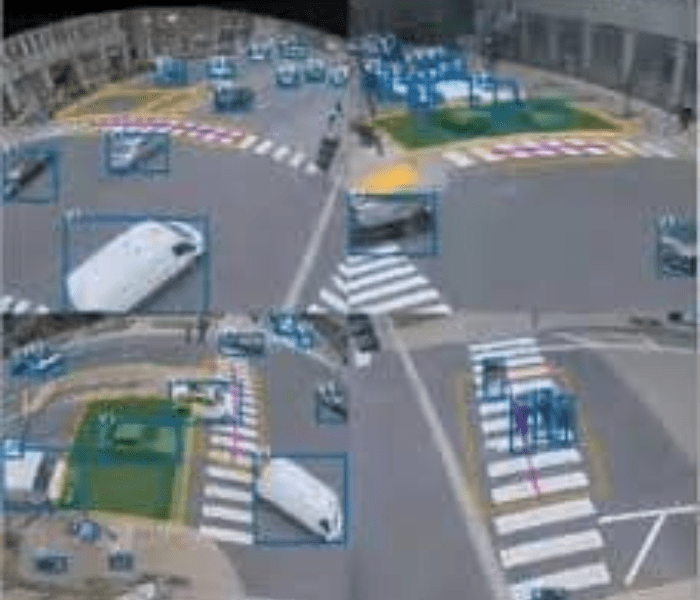
In most U.S. cities, crews record counts during the AM peak hour and PM peak hour. These periods reveal the highest peak hour traffic. Agencies later summarize the data in a formal report. That document becomes part of a traffic report breakdown used for transportation planning, signal timing, and congestion analysis decisions.
Basic Structure of a Traffic Count Table
Every table follows a clear pattern. Rows represent directions like northbound or eastbound. Columns display movement types. Totals appear at the edge. This layout forms your personal intersection volume table guide and helps with traffic data interpretation.
Below is a simplified example measured in vehicle per hour (VPH).
Direction Left Turn Through Right Turn Total VPH
Northbound 120 450 90 660
Southbound 100 420 80 600
Eastbound 150 500 110 760
Westbound 130 480 100 710
Notice how totals reveal movement distribution. High numbers may signal limited roadway capacity. When you study this structure, you begin reading turning movement counts with clarity and confidence.
Understanding Traffic Movement Codes (TMC)
Abbreviations can confuse beginners. However once decoded they become simple. NB-LT means northbound left turn. EB-TH means eastbound through. These labels form the backbone of understanding traffic movement codes and mastering how to read TMC data.
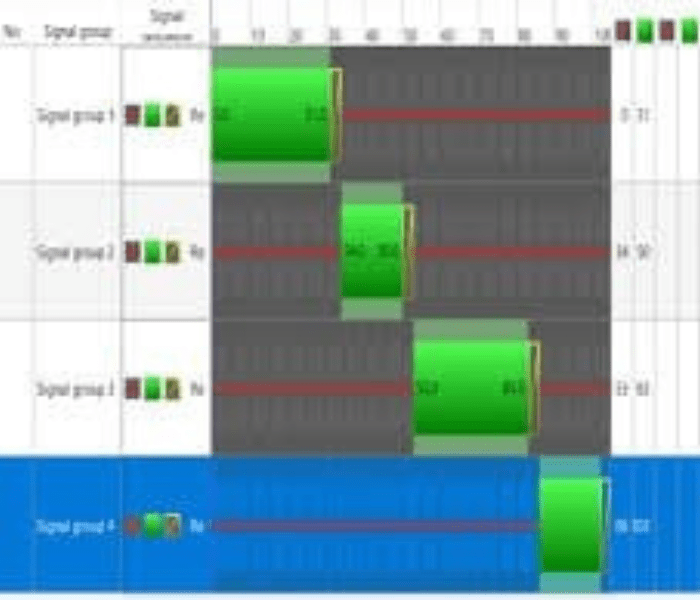
Engineers rely on precise coding for accurate traffic flow analysis. Clean labeling supports signal phasing design and future geometric improvements such as adding a dedicated turn lane. When you grasp these codes, you move closer to how to understand intersection reports used in modern traffic engineering.
Step-by-Step: How to Read an Intersection Traffic Count Table
Start by finding the study period. Is it morning rush or afternoon commute. Then compare each intersection approach total. Next examine the balance between left turn volume, through movement, and right turn volume. This forms your step-by-step traffic analysis process and sharpens how to analyze intersection traffic.
After that calculate the volume-to-capacity ratio. Divide demand by available roadway capacity. A ratio above 1.0 signals stress. Engineers then review the peak hour factor (PHF) to measure flow stability. Together these metrics help you understand how to evaluate intersection capacity and improve overall roadway performance.
Why Traffic Count Tables Matter
Traffic tables guide real decisions. Cities adjust signal timing to reduce queues. Developers submit data during a development impact study. Officials use the results for long-term transportation planning. This proves why understanding traffic count tables matters beyond theory.
Consider a suburban retail project in Texas. Analysts noticed high eastbound peak hour traffic and poor level of service (LOS) ratings. They proposed a second dedicated turn lane. After construction delays dropped and congestion analysis showed smoother flow. That single table changed roadway design.
Common Mistakes When Reading Traffic Tables
Many readers ignore time intervals. They focus only on totals. That mistake hides movement distribution problems. Others misread direction labels and misjudge traffic volume. Careful review prevents flawed traffic data interpretation.
Another error involves ignoring heavy vehicles. Trucks affect roadway capacity differently than cars. Some readers also overlook seasonal shifts. Holiday counts differ from school months. Strong traffic engineering data guide skills help you avoid these traps and strengthen how traffic counts are recorded understanding.
Advanced Interpretation Tips
Professionals go deeper. They compare current counts with historic TMC data. They test alternate signal phasing strategies. They forecast future vehicle movements using growth rates. This advanced layer turns a simple traffic count table explained document into a forecasting tool.
Experts also combine level of service (LOS) grades with the volume-to-capacity ratio. A low grade signals delay. A high ratio signals strain. Together they guide smarter transportation planning decisions and long-term roadway performance upgrades.
Final Thoughts
Now you know How to Read an Intersection Traffic Count Table with clarity. You can decode counts. You can compare peak hour traffic. You can judge roadway capacity. This knowledge transforms raw numbers into insight.
Keep practicing with local DOT reports. Review each turning movement count carefully. The more tables you analyze, the easier How to Read an Intersection Traffic Count Table becomes. Soon you will read them like a seasoned engineer who truly understands the rhythm of traffic.
Meta Description
Learn how to read an intersection traffic count table and understand TMC data, traffic volume, and peak hour patterns.
FAQs
How to measure traffic count?
Traffic count is measured using manual observers, video cameras, pneumatic tubes, or in-road sensors that record vehicle movements over a set time period.
What is considered a high traffic count?
In urban U.S. areas, more than 30,000 vehicles per day is often considered high, though it depends on road type and roadway capacity.
What is the intersection volume count?
An intersection volume count is the total number of vehicles entering an intersection from all approaches during a specific time.
How does a traffic counter work?
A traffic counter detects vehicles using sensors, tubes, radar, or cameras and converts each detection into recorded traffic data.
What are the methods of traffic count?
Common methods include manual counts, automatic traffic recorders, video image processing, and radar-based detection systems.
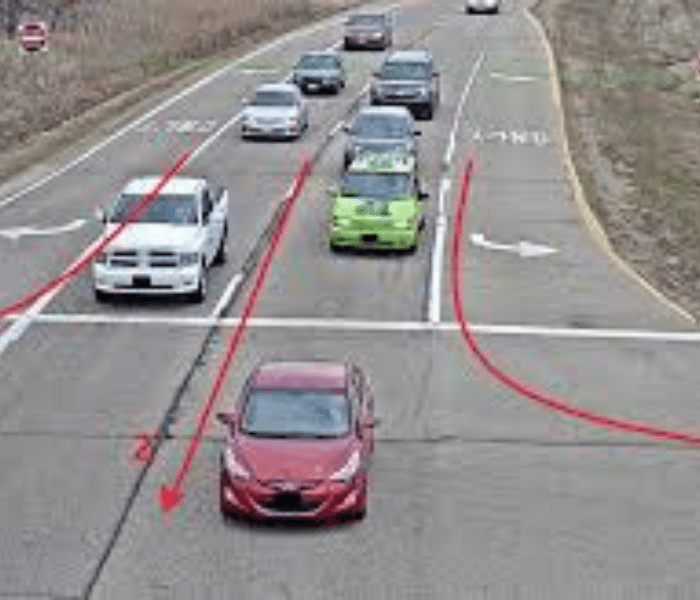
How do I know if I jumped a red light?
If your vehicle crossed the stop line after the signal turned red, you likely ran the red light.
How to prove you didn’t run a red light?
You can request camera footage, intersection timing records, or present witness statements to challenge the citation.
What if I accidentally went through a red light?
You may receive a citation if captured by enforcement cameras or police, even if the violation was unintentional.
How long after a light turns red does it take a picture?
Most red light cameras activate about 0.3 to 0.5 seconds after the signal turns red.
How to read an intersection traffic count table PDF?
Review direction labels, turning movement counts, peak hour totals, and units such as vehicles per hour.
Numbers every traffic engineer should know?
Key numbers include Average Daily Traffic (ADT), peak hour factor (PHF), volume-to-capacity ratio, and level of service thresholds.
State traffic data?
State traffic data is published by each state’s Department of Transportation and includes ADT, truck percentages, and hourly volumes.
Hourly traffic data?
Hourly traffic data shows the number of vehicles passing a location within each one-hour interval.
Traffic count by address USA?
You can search traffic counts by address through your state DOT website or the Federal Highway Administration data portal.
How to calculate level of service traffic?
Level of Service is calculated using delay, volume-to-capacity ratio, and control type based on Highway Capacity Manual standards.
Truck traffic data?
Truck traffic data shows the percentage and volume of heavy vehicles using a roadway segment.
What is average daily traffic?
Average Daily Traffic (ADT) is the average number of vehicles passing a location over a 24-hour period.