How Often Are Intersection Traffic Counts Updated in U.S. Cities?
Intersections change more quickly than most people expect. A new store, school, or housing project can increase traffic volume almost overnight. That is why cities follow regular traffic data collection plans to keep information current. Engineers study vehicle counts, traffic patterns, and turning movements to understand how roads are used.
These updates support smarter transportation planning and help officials decide when signals or lanes need changes. Knowing how often cities collect traffic data also explains why some intersections receive upgrades sooner than others. With accurate numbers, planners can improve safety, reduce delays, and respond to real traffic growth trends instead of relying on outdated assumptions.
How Often Cities Collect Traffic Data
Cities follow organized plans to decide how often cities collect traffic data. Most agencies rely on a rotating traffic count schedule where major signalized intersections are studied every two to three years. This intersection traffic count cycle helps track traffic patterns and turning movements across the road network. Through regular city traffic data collection, engineers monitor traffic volume and adjust roadway planning decisions.
Busy areas often need faster road traffic data updates. Growing corridors may use annual traffic counts or special traffic impact study counts. These studies are part of larger traffic data collection programs used for transportation planning and traffic engineering. A flexible traffic study timing approach ensures the frequency of intersection studies matches real growth instead of fixed assumptions.
Road Type Typical Count Cycle Purpose
Major arterial Every 2–3 years Congestion management
High-growth corridor Every year Track traffic growth trends
Local streets Every 3–5 years Basic roadway planning
New development areas As needed Traffic impact studies
Typical U.S. Intersection Traffic Count Cycles
Across the country, agencies follow similar rules for how often traffic counts are done. Many states use highway traffic count cycles that repeat every three years. This system keeps traffic monitoring current across the entire road network. Engineers combine urban traffic counting with highway data collection to maintain balanced planning.

Some locations use short-term traffic counts for quick studies. Others rely on continuous traffic data collection through automated sensors at smart intersections. This combination improves intersection analysis and helps agencies adjust traffic monitoring programs when conditions change.
Study Type Duration Use
Short-term counts 1–7 days Local studies
Annual counts Once per year Growth areas
Continuous counts 24/7 Smart intersections
Rotating counts Every few years Network-wide updates
Traffic Count Update Frequency
The traffic count update frequency depends on road type, safety needs, and funding. Busy corridors with heavy traffic volume often require faster traffic monitoring programs. These areas may follow a tight traffic count schedule to track turning movements and prevent congestion. This approach supports accurate intersection study timing and stronger congestion management.
Technology also shapes traffic count update frequency. Many cities now use automated sensors for continuous traffic data collection. These tools track vehicle counts and real-time traffic patterns at signalized intersections. With smarter systems, agencies improve road safety planning and support better transportation planning decisions.
Factor Effect on Update Frequency
High traffic volume More frequent counts
New development Special traffic impact studies
Crash history Faster study timing
Smart sensors installed Continuous monitoring
Intersection Study Schedule
Every city maintains an intersection study schedule to organize data collection. This schedule sets a clear traffic study timing plan for major crossroads. Through a consistent traffic count schedule, engineers review turning movements, update traffic patterns, and plan safer roadway planning strategies. These steps keep traffic engineering decisions based on facts.
Development projects often change the intersection study schedule. New malls or housing projects trigger traffic impact study counts and extra road traffic data updates. These changes influence the frequency of intersection studies and improve transportation planning. A well-managed intersection traffic study timing plan helps cities maintain safer roads and smoother travel.
Trigger Study Action
New shopping center Traffic impact study counts
Rising congestion Short-term traffic counts
Safety concerns Immediate intersection analysis
Major road upgrade Full intersection study schedule
In simple terms, understanding how often cities collect traffic data helps explain modern road planning. A clear traffic count update frequency and organized intersection study schedule keep data fresh. With accurate numbers, engineers improve safety, reduce congestion, and build smarter roads for the future.
Meta Description
Learn how often intersection traffic counts are updated and how cities use data to improve safety, signal timing, and traffic flow.
FAQs
Is there a Bureau of traffic cone counting?
No, there is no such agency; it’s usually a joke or satire, not a real government department.
How many signalized intersections are there in the US?
Estimates suggest the U.S. has over 300,000 signalized intersections, though exact numbers vary by source.
What is the traffic counts dataset?
It’s a collection of data showing vehicle numbers, directions, and times at specific locations, used for planning and signal timing.
What is the US traffic congestion dataset?
It’s a set of data from sensors, GPS, and studies that tracks delays, speeds, and congestion levels across U.S. roads.
What is the most traffic-congested city in the US?
Recent studies often rank New York City as the most congested U.S. city.
How accurate are traffic forecasts?
They are generally reliable for short-term planning but can vary due to unexpected events like crashes, weather, or new developments.
Why do weathermen exaggerate?
They usually don’t exaggerate intentionally; forecasts highlight worst-case scenarios to keep people prepared for possible risks.
How accurate is Google Maps traffic estimator?
It is highly accurate for real-time conditions because it uses live GPS data from millions of users.
Can AI predict traffic patterns?
Yes, AI can analyze historical and real-time data to predict congestion, travel times, and traffic patterns with increasing accuracy.
U.S. traffic volume data?
U.S. traffic volume data is collected by state DOTs and the Federal Highway Administration, showing vehicle counts on highways and major roads.
Daily traffic count data?
Daily traffic count data records the number of vehicles passing a location each day, often used to calculate averages like AADT.
Traffic count by address?
You can find traffic counts by address through state or city DOT websites, which provide maps or search tools for specific road segments.
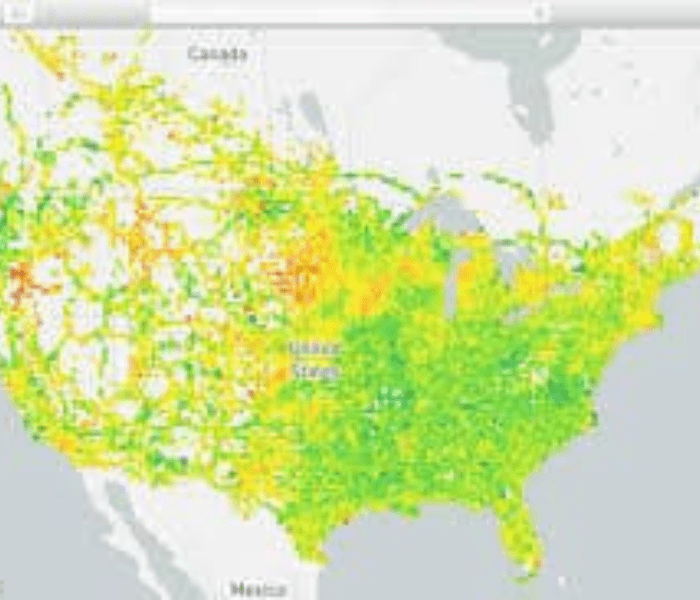
Traffic volume map?
A traffic volume map displays vehicle counts across a road network, usually available through state DOT GIS portals.
AADT traffic data?
AADT stands for Annual Average Daily Traffic, which is the average number of vehicles using a road each day over a year.
Department of Transportation traffic counts?
State and local Departments of Transportation collect and publish traffic count data for planning, safety studies, and road improvements.
Traffic Count Database System?
It is a digital system used by transportation agencies to store, manage, and analyze traffic count data from multiple locations.
Esri traffic counts?
Esri provides traffic count datasets within its GIS platforms, offering estimated traffic volumes for roads to support mapping and analysis.